My Rate Limiter Passed Every Test. It Still Let Through 199 Requests.
Part 1 of 3 on building a rate limiter in Go. Code: github.com/Jeetjyoti-Deka/go-rate-limiter
I picked a rate limiter because it looked like a two-evening project. A counter, a timestamp, a mutex. Maybe a third evening if I got fancy.
Eight phases later I have a repo with four benchmark suites and a folder of design notes, and the reason I kept going is this: my first implementation was correct. It passed a nine-property test suite under the race detector. And it admitted 199 requests in a single millisecond against a configured limit of 100 per minute.
Nothing was broken. That turned out to be the interesting part, and it's what this post is about.
Starting where everyone starts
A rate limiter is a counter and a timestamp. For each key, remember when the current window started and how many requests have landed in it. Window expired? Reset. Room left? Admit.
key "alice" → { start: 12:00:00.000, count: 47 }
Twenty lines. And those twenty lines contain a bug that reads as perfectly fine right up until you picture two goroutines arriving at once:
count := l.counts[key]      // read
if count < l.limit {        // decide
    l.counts[key] = count+1 // act
}
Both read 99 against a limit of 100. Both decide there's room. Both write 100. Two requests, one slot.
The fix isn't "put a mutex somewhere" — it's that the read, the decision and the write all have to happen inside one critical section. A lock held only across the write is theatre; the decision was already made on stale data.
Before writing any limiter at all, I wrote the test that catches this. And I want to flag one character in it:
// The window is an hour and the clock never advances, so no replenishment can
// occur: the count must be exact, not merely bounded.
if got := allowed.Load(); got != limit {
    t.Errorf("admitted %d of %d attempts, want exactly %d",
        got, goroutines*perG, limit)
}
!=, not >. The obvious assertion is <= limit, and it's useless — a lost-update race makes a limiter admit fewer, so an upper bound sails right past it. It also passes for a limiter that deadlocks after ten requests. Exact equality catches both.
That one character is most of what I'd tell past-me.
Correct, and wrong anyway
With the mutex in the right place, the fixed-window limiter is genuinely correct. Nine properties, 1,280 concurrent goroutines, -race clean. I was pleased with myself for about an hour.
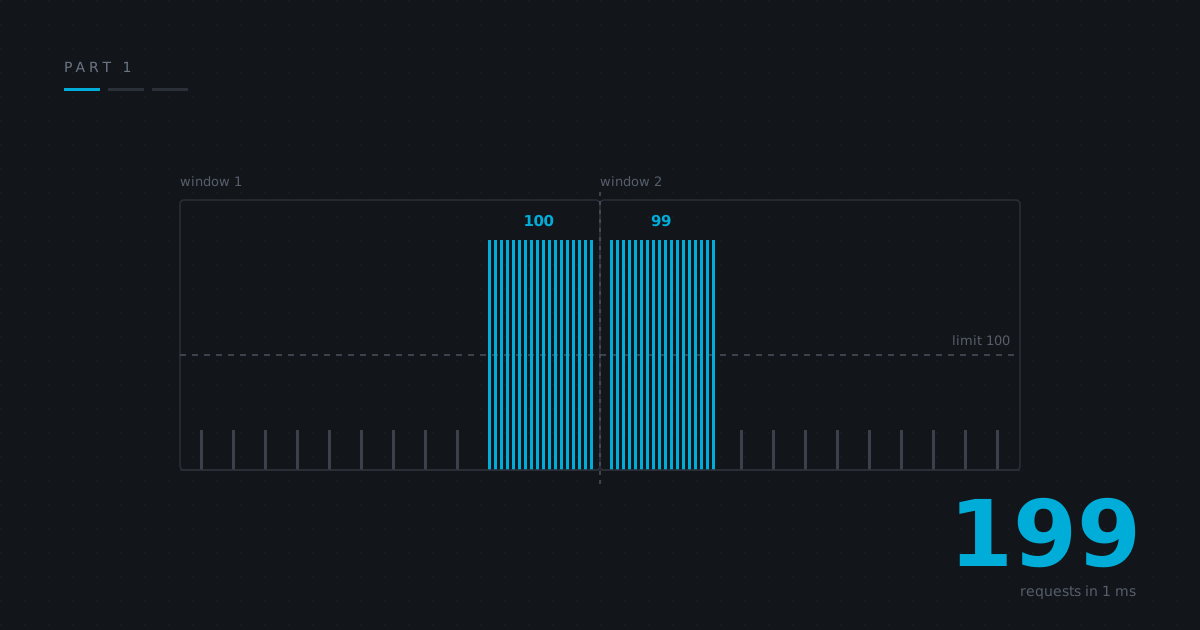
Then I wrote a test to see what happened at a window boundary:
limit = 100 per minute

window 1 [00:00 ── 01:00)         window 2 [01:00 ── 02:00)
                    ▲             ▲
              100 requests   100 requests
              at 00:59.999   at 01:00.000

              └──── 200 requests in 1 ms ────┘
199 requests admitted inside a 1 ms span. Against 100 per minute.
And here's the thing that took me a minute to accept: the test passes. Each window independently admitted exactly 100. The limiter's contract — at most limit per window — held perfectly. The contract I thought I was configuring was "at most 100 in any 60-second span," and a fixed window has never once promised that.
What it promises is 100 per bucket. Anyone who knows where the boundary falls gets 200 in any span containing it. If that limiter is protecting a database connection pool, a 2× spike is the difference between headroom and an incident.
So the test that demonstrates it lives in the package, not in the shared conformance suite. It's a property of the algorithm, not a defect in my code — and a conformance suite only ever encodes the properties you thought to name. "Doesn't admit double at a boundary" isn't a property that occurs to you until you've seen it happen.
Turning burst into a decision
The token bucket fixes it, and not by making the limit stricter. It separates two things the fixed window had quietly welded together:
rate — sustained throughput, over the long run
burst — how much unused quota can pile up, i.e. the biggest instantaneous spike you'll tolerate
A fixed window gives you one dial. Setting limit per window sets the rate and implicitly sets burst to 2 × limit — a number nobody chose, that fell out of the data structure.
The implementation detail I'd steal for anything else: compute the refill lazily, on read.
elapsed = now - last
tokens  = min(burst, tokens + elapsed × rate)
last    = now
My first instinct was a goroutine per bucket topping it up on a ticker, because "tokens accrue continuously" sounds like something that needs a ticker. That design costs a goroutine and a timer per key, and with a million keys it burns most of its CPU waking up to top off buckets nobody is using. Computing on read means an idle key costs its stored state and exactly zero CPU.
Two things I got wrong on the first pass:
Advance last even when you deny. Refill is a function of elapsed time, not of the decision. I originally wrote if allowed { b.last = now } by reflex, which under sustained load throws away the time since every rejected request and steadily under-refills the bucket.
Retry-After has to round up. The wait for one token is (1 - tokens) / rate, which essentially never lands on a whole nanosecond. Truncate it and you're telling the client to retry at an instant where the bucket is a fraction of a token short — they retry, get denied, and your helpful header has cost them a round trip. At 3 tokens/sec the deficit is 333333333.33 ns. Truncating gives 333333333, which refills 0.999999999 tokens. math.Ceil gives 333333334, which refills 1.000000002.
There's a test that fails without that ceiling, which is worth having, because a comment explaining the reasoning doesn't run in CI.
Same test, same structure, both limiters:
| Algorigthm | admitted in 1 ms |
|---|---|
| fixed window | 199 |
| token bucket | 100 |
Then I tried to make it fast, and it got slower
Both limiters funnel every key through one mutex. That's correct, and I wanted to know what it cost before believing anything about it.
So I built three versions of the same token bucket, with the arithmetic pulled out into an internal package so all three call literally the same function. That matters more than it sounds: if I'd copy-pasted the maths three times, any typo would show up as a timing difference and I'd have confidently attributed it to the locking strategy.
Global mutex — one lock, one map
Sharded — 64 independently locked partitions,
maphash(key) & maskPer-key —
sync.Mapof entries, each carrying its own mutex
Distinct keys, ns/op, on a 4-core machine:
| Strategy | 1 core | 2 | 4 | 8 |
|---|---|---|---|---|
| Global mutex | 159.0 | 195.5 | 292.0 | 312.2 |
| Sharded | 225.6 | 90.04 | 69.71 | 64.25 |
| Per-key | 163.6 | 84.95 | 47.64 | 49.04 |
Read the first row again. The global mutex doesn't just fail to scale — it goes backwards. 159 ns on one core, 312 on eight. Adding cores makes it twice as slow.
The work per request never changes, so every one of those added nanoseconds is pure coordination: goroutines parking and unparking on a single futex. In throughput terms that's ~3.2M ops/sec against ~21M for per-key locking, on the same four cores.
I didn't want to assert the contention, so I profiled it:
Type: delay
     6.41s 99.80%  sync.(*Mutex).Unlock
         0     0%  tokenbucket.(*Limiter).AllowN
99.8% of all blocking in the process, in one lock, with the path to it. Two things about that output confused me at first, so: Go attributes the delay to Unlock because it records the wait imposed on everyone else at the moment the holder lets go. And 6.42s of delay inside a 5-second run isn't a contradiction — it's summed across four goroutines.
The other surprise is in the first column. Sharding isn't free, and you pay up front. On one core it's the slowest option — 225.6 against the plain mutex's 159.0. The hash and the extra indirection are dead weight when there's nothing to contend over. It only starts paying you back under parallelism, and then it pays back 3.24×.
The benchmark that told me to do the wrong thing
Per-key locking wins every single latency cell above. I was ready to call it and move on.
Then I measured memory per key — which the latency benchmarks structurally cannot see, because they report 0 allocs/op: they run in steady state, after every key already exists.
| Strategy | retained per key | allocations |
|---|---|---|
| Global mutex | 66.95 B | 1 |
| Sharded | 66.95 B | 1 |
| Per-key | 172.3 B | 3 |
Per-key locking costs 2.57× the memory. sync.Map boxes every value in an interface, wraps it in its own entry type, and keeps read and dirty maps that both hold live entries — and that's before the mutex sitting next to each bucket.
At a million tracked keys that's 67 MB versus 172 MB. Same limiter.
And rate limiter keys are usually attacker-controlled. An IP. A token. Whatever the client hands you. The strategy that costs 2.57× per key is the wrong default for a component whose entire job is surviving a flood — so the recommendation is sharded, paying ~1.46× the latency at high cardinality to close that exposure while still getting 3.24× scaling.
That's the opposite of what the latency tables say on their own. I'd have landed on the wrong default if I'd stopped one benchmark earlier, which is the most useful thing this project taught me: a benchmark that measures one dimension will recommend confidently and wrongly.
What being exactly right costs
With synchronisation settled, the remaining variable was the algorithm. I implemented five and held all of them to the same conformance suite.
The one that got me was the sliding window log — store every admission timestamp, count the ones still inside the trailing window. It's the only algorithm here that's exactly correct. Over any interval of one window, never more than the limit. No boundary burst, no estimation error, nothing to argue about.
I swept the limit to see what that costs:
| limit | bytes per key |
|---|---|
| 10 | 322.9 |
| 100 | 2,771 |
| 1000 | 24,659 |
Subtract the map overhead and it's 24.6 bytes per stored timestamp — which is exactly sizeof(time.Time), and seeing theory land on the nose like that was the most satisfying moment of the whole project. At a limit of 1000 that's 24.7 KB per key, 368× a token bucket, and 24 GB at a million keys.
Same algorithm, opposite verdict at each end. Perfect for 5 login attempts per hour, at 323 bytes a key. Completely disqualifying for 1000 requests a minute. You only see where it flips if you sweep the limit, which I nearly didn't bother doing.
The one that speeds up when you hit it harder
The last algorithm is GCRA, borrowed from ATM networking, and it's my favourite thing in the repo. Behaviourally it's a token bucket. What differs is the state: a single instant — the theoretical arrival time at which the bucket would next be empty — where a token bucket needs a float and a timestamp.
One instant fits in one 64-bit word. Which means the update can be a compare-and-swap instead of a mutex:
for {
    old := tat.Load()
    // ... compute the decision ...
    if !allowed {
        return decision          // no write at all
    }
    if tat.CompareAndSwap(old, newTat) {
        return decision
    }
}
Look at the denial path. It writes nothing. Load, compute, return.
That inverts the usual failure mode, and it's a big deal. A mutex-based limiter contends hardest exactly when it's rejecting the most traffic, because every rejection still takes the lock. Measured on a drained hot key:
| Algorithm | 1 core | 2 | 4 | 1→4 |
|---|---|---|---|---|
| Fixed window | 70.94 | 81.09 | 85.89 | 0.83× |
| Token bucket | 102.7 | 117.0 | 119.8 | 0.86× |
| GCRA | 72.97 | 37.30 | 20.70 | 3.53× |
It's the only limiter in the repo that gets faster as you add cores. At four cores it rejects in 20.7 ns against the token bucket's 119.8 — 48 million rejections a second against 8 million.
Two honest caveats, because the headline oversells it.
On a single core it's unremarkable: 72.97 against the fixed window's 70.94. Nothing about its arithmetic is faster. The entire advantage is not serialising, and it only shows up when something is contending.
And it cost me a prediction. I'd written in my notes that GCRA's 8-byte state would make it the cheapest per key. Measured, it's 127 bytes — nearly double the token bucket's 67. The state shrank and the container grew: being lock-free requires a lock-free container, which means sync.Map, which means interface boxing. A small state only buys you a small footprint when the container is cheap too, and lock-freedom rules out the cheap container.
That's twice now that measuring contradicted something that sounded obviously true. I've started treating "obviously" as a prompt to go and check.
The tests were wrong, not the code
One last thing, because it's the part I didn't expect.
Writing five implementations against one suite turned up two assertions in the suite that were simply wrong.
RetryAfter ≤ window looked like a universal truth when I wrote it. It's false for a sliding window counter: exhaust the limit at the start of a window, and the estimate stays at limit for that whole window, then carries into the next one weighted 1.0. The earliest possible success is over a window away, and the honest RetryAfter exceeds window.
The limiter was right. My assertion was an artefact of a sample size of four, all from the same family. It's now RetryAfter ≤ ResetAfter, which holds for every algorithm because time-until-this-request-succeeds can never exceed time-until-fully-replenished.
Same story for "one idle window restores capacity" — a sliding window correctly denies, because one window after burning your quota the trailing window still contains it. That's what sliding means.
The tempting move was to special-case the counter out of two assertions and keep the suite green. I'm glad I didn't: a suite you edit to stay green isn't measuring anything. Changing the test and writing down the argument is the only version of this that's worth having.
Where that leaves us
Five limiters. One suite. Four benchmark comparisons, each with exactly one controlled variable. Every performance claim traceable to a number you can re-run.
And all of it correct only because it runs in one process.
Every map here lives in this heap. Every sync.Mutex excludes these goroutines. Every CompareAndSwap is atomic across these cores. None of that says a single thing about the identical binary running on the machine next to it.
Which is Part 2, where a limiter configured for 100 admits 300 — and every instance reports itself perfectly healthy while it happens.
Everything above is in github.com/Jeetjyoti-Deka/go-rate-limiter, with the design notes written during each phase rather than after. Every phase is tagged, so v0.1-fixed-window is the tree where the boundary burst is real and unfixed if you want to watch it happen.


