I Ran Three Copies of My Rate Limiter. It Let Through 300.
Part 2 of 3 on building a rate limiter in Go. Code: github.com/Jeetjyoti-Deka/go-rate-limiter
In Part 1 I built five rate limiting algorithms, held all of them to one conformance suite, benchmarked three synchronisation strategies, and found a couple of places where the measurement contradicted what I'd confidently written down.
All of it worked. Then I started a second copy of the process and none of it worked, and the part that bothers me most is that nothing anywhere reported a problem.
The assumption nobody writes down
Go back through everything in Part 1 and there's an assumption underneath all of it that I never stated, because it never came up.
map[string]*bucket.State is a map in this process's heap. sync.Mutex excludes this process's goroutines. atomic.CompareAndSwap is atomic with respect to this process's cores.
Every one of those is a statement about a single address space. None of them says anything about the identical binary running on the machine next to it.
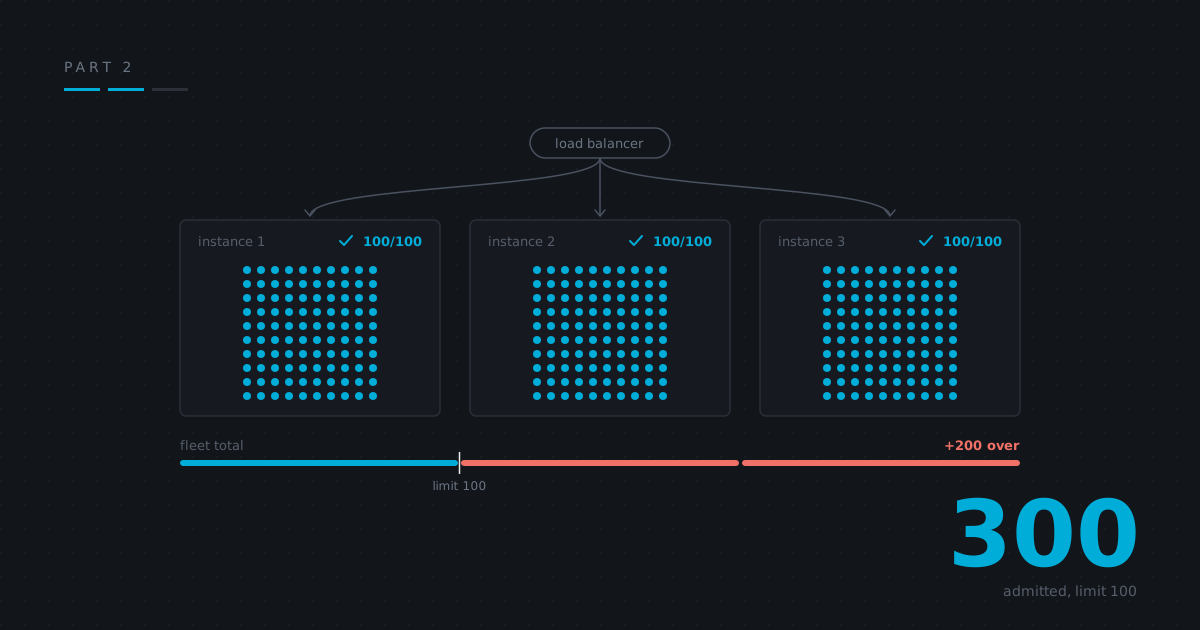
So: three replicas behind a load balancer, configured for 100 requests per minute. Each replica independently admits 100. The service admits 300.
                       ┌──────────────┐
                  ┌───►│  instance A  │  admits 100  ─┐
                  │    └──────────────┘               │
   client ───► LB ┼───►┌──────────────┐               ├──► 300 admitted          |    |  instance B  |  admits 100  ─┤
                  │    └──────────────┘               │
                  └───►┌──────────────┐               │
                       │  instance C  │  admits 100  ─┘
                       └──────────────┘

            configured limit: 100        actual: 300
And again — nothing is broken. Each instance enforced exactly the limit it was given, against exactly the requests it saw. Its contract said at most limit per window, per key, as observed by me. That last clause is invisible in one process, because there's nothing else to observe anything.
It's not an algorithm problem
My first instinct was to go looking for the algorithm that survives this. There isn't one, and rather than argue about it I wrote a test that runs all five:
| Algorithm | configured | admitted across 3 instances |
|---|---|---|
fixedwindow |
100 | 300 |
tokenbucket |
100 | 300 |
windowlog |
100 | 300 |
windowcounter |
100 | 300 |
gcra |
100 | 300 |
Identical, because the defect isn't in any of them. An algorithm decides what to remember. It has no opinion about where. Swapping a fixed window for GCRA changes the shape of the burst and the cost of a rejection, and changes nothing whatsoever about three processes keeping three separate counters.
That uniformity is the whole point of running all five. One row would invite the reading that a different algorithm might save you.
This is also the moment the problem stops being a programming problem and becomes a distributed systems problem. No amount of care inside one process fixes it. The fix has to come from outside the process.
The worst part is how quiet it is
A bug that crashes is cheap. A bug that logs an error is cheap. This one does neither.
Every instance reports healthy. Every instance's metrics show it admitting at or under its configured limit — truthfully. Every X-RateLimit-Remaining header the service emits is accurate from the perspective of whichever instance answered. There's no error, no log line, no alert, and no single place where the aggregate is visible, because no component in the system computes the aggregate.
You find out when the database, the limiter was protecting, falls over and the limiter's own dashboards say it was doing its job perfectly.
Your rate limit is now an autoscaling policy
The effective limit is configured_limit × instance_count, and that second term belongs to your autoscaler.
Scale three replicas to ten under load, and your rate limit silently becomes 1000/min — at exactly the moment the extra traffic made you scale.
Roll a deploy: old and new pods overlap, instance count briefly doubles, so does the limit.
Run a canary: it has its own counters. Your limit is
100 × (N + 1).
A number someone chose deliberately, reviewed, maybe published in an API contract, is in practice a function of a scaling policy nobody thought of as security-relevant. And it's highest precisely when load is highest, which is the exact opposite of what you wanted.
Writing it down as a test that fails
I wanted this in the repo as something you can run, not a diagram you can nod at. So there are two tests, and the pairing is the point.
TestInstancesOverAdmit passes. It asserts the behaviour that actually happens — exactly instances × limit — for all five algorithms. Asserting the bug sounds backwards until you notice what it buys: once the fix lands, an implementation that silently falls back to per-instance state will keep this test passing when it should have started failing. It's the tripwire.
TestAggregateLimitHolds fails. It asserts what I thought I'd configured. It sits behind a build tag so CI stays green, and you run it on purpose:
$ go test -tags brokenbydesign ./distributed/
--- FAIL: TestAggregateLimitHolds/tokenbucket
    3 instances admitted 300 requests against a configured limit of 100: the limit is enforced per instance, not per service
FAIL
There's also a version with actual processes, because three HTTP servers and a load generator is more visceral than an assertion:
3 instances, each configured for 100 requests
sent      1000 in 42ms
admitted  300
rejected  700

effective limit: 300 (3.0x the configured 100)
Three ways out, two of them bad
Sticky routing. Hash each client to a fixed instance, so one key is only ever seen by one limiter, and the per-instance view becomes the whole view.
It falls apart on contact. Instance counts change, and every rescale reshuffles the hash, so clients land on instances with no history and get a fresh full quota — scaling events become quota resets. Load distributes by key instead of by request, so one heavy client pins an instance while others idle. And it can't express a global limit at all: "1000 requests per minute across all customers" has no single key to hash. Worst of all, it couples your rate limiting correctness to your load balancer's config, which is a dependency written down nowhere.
Divide the limit by N. Give each instance limit / N. Three instances, 33 each.
Arithmetically appealing, behaves badly. It assumes traffic spreads evenly; when it doesn't, a client whose requests land on one instance gets a third of their entitlement while capacity sits unused elsewhere. Every instance has to know N accurately and immediately, so an autoscaling event must reconfigure every replica, and during the gap you're either over- or under-limiting. A crashed instance permanently loses its share until something notices. It converts a correctness problem into a capacity problem plus a configuration problem, and solves neither.
Shared state. Move the counters somewhere every instance can see.
That's the answer, and it's the rest of this post.
The bug that was already waiting in Redis
The direct translation looks obvious:
tat, _ := client.Get(ctx, key).Int64()   // read
// ... compute the decision ...
client.Set(ctx, key, newTat, ttl)        // write
That's check-then-act. The same bug from Part 1 — read, decide, write, with a gap in the middle where someone else does the same thing.
What's different is the size of the gap. In one process it's a few nanoseconds, and you need real parallelism to land inside it; the conformance test needed 1,280 goroutines to catch it. Across a network it's a full round trip, hundreds of microseconds, and every concurrent request in that window reads the same stale value.
I wrote both tests. The first establishes that the arithmetic is fine — serial requests against a limit of 10 admit exactly 10. Then the second fires 100 concurrent requests at a fresh key, same limit of 10:
100 concurrent requests against a limit of 10: admitted 100 (10.0x the limit)
All one hundred. Not one of them observed another's write.
Notice the escalation. It took three separate processes to exceed the limit by 3×. It takes one process and a bit of concurrency to exceed it by 10×, because the race window went from nanoseconds to a round trip.
And there is no mutex to reach for. sync.Mutex excludes goroutines in one address space; it has nothing to say about another process on another machine. The tool that fixed this in Part 1 simply isn't available.
Lua is the mutex you don't have
Redis executes commands on a single thread, and a script submitted with EVAL runs to completion before any other command is served.
That's the whole mechanism. A script is a critical section, and Redis is the lock.
So the read, the decision and the write move into the server:
local tat = tonumber(redis.call('GET', KEYS[1])) or now
if tat < now then tat = now end

local newTat  = tat + cost
local allowAt = newTat - tolerance

if allowAt > now then
  return { 0, ... }              -- denied, nothing written
end

redis.call('SET', KEYS[1], newTat, 'PX', ttl)
return { 1, ... }
Nothing can interleave between the GET and the SET, because nothing runs at all until the script returns. The check-then-act window doesn't shrink — it stops existing.
Same 100 concurrent requests, same limit of 10, same Redis: exactly 10 admitted. The only thing that changed is whether the read-modify-write happens in one place or three.
It's also one round trip instead of two, so the latency halves as a side effect of fixing the correctness problem. Nice, but secondary.
One thing to be careful about: Redis being single-threaded is what makes this work and also what makes it dangerous. A script that takes a millisecond blocks every client for that millisecond. This one is a handful of arithmetic operations on one key and runs in microseconds. A script that looped over a thousand stored timestamps would not be.
Which is why I used GCRA
In Part 1, GCRA's single-instant state bought a lock-free compare-and-swap. In Redis the same property pays off three more times:
One key, one value. The whole state is a single integer, so it's
GET/SET— not a hash with several fields that have to be updated together.A script short enough to be safe. Five lines of arithmetic, no loops, nothing that iterates over stored entries.
Nothing to serialise. No encoding, no decoding, no format to version.
Compare the alternatives. A token bucket needs a token count and a timestamp — two values that must move atomically, so a hash and a longer script. A sliding window log needs every timestamp: a sorted set, a ZREMRANGEBYSCORE on every request, memory in Redis proportional to limit × keys, and a script whose cost grows with the limit.
The state size that bought concurrency in Part 1 buys network payload, script duration and atomicity scope here. Same property, three different currencies — and the argument for small state gets stronger the further the state has to travel. I did not see that coming when I picked GCRA.
Whose clock is it?
Part 1 was careful that every time comparison be a time.Time subtraction, so the monotonic clock reading survives and an NTP correction can't make elapsed time go negative.
None of that survives the move. There are three instances now, each with its own clock, and they disagree. Not by much — NTP keeps datacentre machines within milliseconds — but a limiter doing arithmetic on timestamps from three different sources produces a state that jumps backwards whenever a request lands on the instance whose clock runs slow.
The fix is to stop asking the instances:
local t = redis.call('TIME')
local now = tonumber(t[1]) * 1000000 + tonumber(t[2])
One authoritative clock, shared by everyone, read inside the critical section. Instance clock skew stops mattering because instance clocks are no longer consulted.
Three things worth knowing before you copy that:
It needs effects replication. TIME is non-deterministic, and older Redis refused non-deterministic commands in scripts because replicas replayed the script verbatim. Since Redis 5.0 scripts replicate by their effects — the resulting SET, not the script — so TIME is fine. On Redis 7 this needs no configuration.
It's a wall clock. Redis has no monotonic clock to offer, so all that careful monotonic discipline doesn't survive this boundary. An NTP step on the Redis host moves everyone's notion of now. The mitigation is operational — run NTP with slew rather than step — not something the code can fix.
A failover changes clocks. Promote a replica and TIME now comes from a different machine. If that one's clock is behind, everything is suddenly scheduled in the future relative to it and clients get throttled until it catches up.
The one thing that got easier
Earlier in the project I'd built an eviction sweeper: a background goroutine, a Close() method, a ticker, and a measured 1.34 ms to scan 100,000 keys — all to delete keys that had been idle long enough that their state was indistinguishable from a fresh one.
In Redis that's a parameter on the write I was already doing:
redis.call('SET', KEYS[1], newTat, 'PX', ttl)
No goroutine, no lifecycle method, no sweep, no scan. This is the one dimension where the distributed version is strictly better than the in-process one, and it was a genuinely pleasant surprise after the previous section's list of things that got worse.
What it cost
Same algorithm, same machine, state in this process versus state in Redis on loopback — no network hop at all:
Allow |
allocations | |
|---|---|---|
| in-process GCRA | 73.5 ns | 0 |
| Redis GCRA | 289,000 ns | 17 |
Roughly 3,930×.
I'd guessed "about four orders of magnitude" from first principles before measuring, so that one landed — which was reassuring after Part 1, where two of my predictions didn't.
Read it as a floor. This is Redis in a container on the same box; a real deployment adds a datacentre crossing. The 17 allocations belong to the Redis client encoding the command and parsing the reply, not to the limiter — worth naming so nobody optimises the wrong layer. The cost here is the round trip, and no amount of Go tuning moves it.
And that's before the other two things I've just bought: a single point of failure that can take down the service it was installed to protect, and a bottleneck where every request from every instance converges on one key on one single-threaded server — which is exactly what all that sharding work in Part 1 existed to avoid.
Where that leaves us
The limiter is correct across instances now. Three independently constructed limiters sharing one Redis keyspace admit exactly 100 between them, which is what the failing test was asking for all along.
It also costs 289 microseconds per request and introduced a dependency that can take the whole thing down.
That's the right answer to the wrong question. The question isn't "how do I share state" — it's "how much coordination does this actually need?" And it turns out the answer is nowhere near once per request.
Part 3 is about buying less of it: local buckets, quota leased in blocks, a dial between accuracy and chattiness, and what to do when Redis is gone — where the honest answer is that there isn't a correct one, only a policy, and picking the wrong default turns a component meant to improve reliability into the thing that takes you down.
Everything above is in github.com/Jeetjyoti-Deka/go-rate-limiter. v0.5-the-break is the tree where the failing test is real and unfixed; v0.6a-redis-naive is the deliberately racy Redis implementation if you want to watch it admit a hundred.