I Stopped Calling Redis on Every Request And It Got 97× Faster.
Part 3 of 3 on building a rate limiter in Go. Code: github.com/Jeetjyoti-Deka/go-rate-limiter
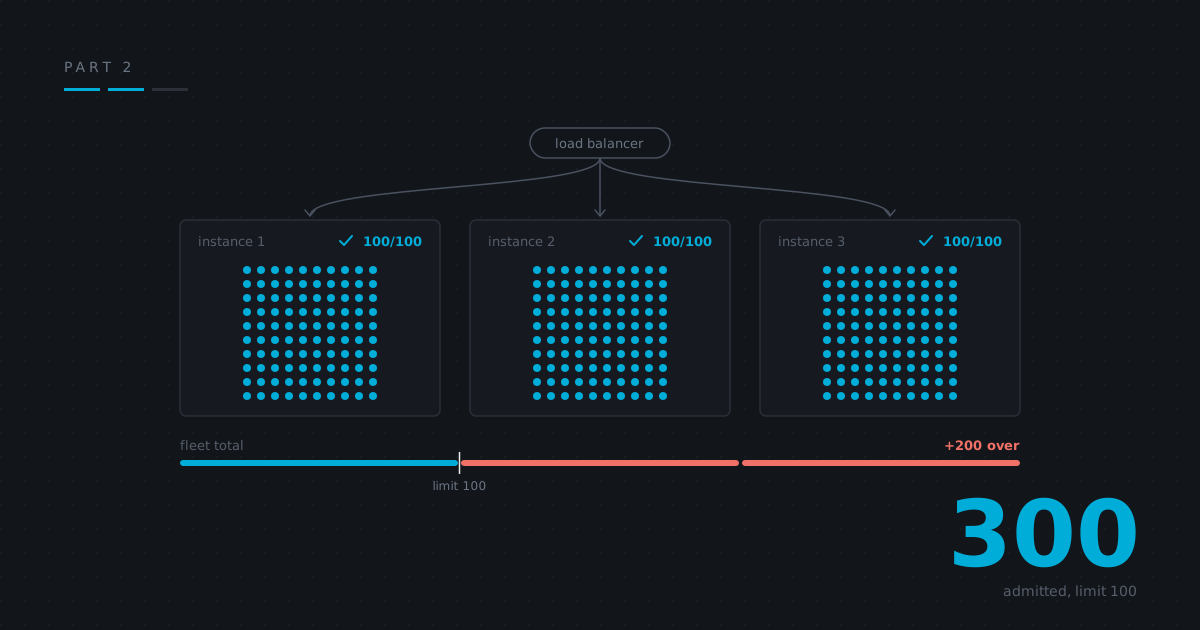
Part 2 ended somewhere uncomfortable. My rate limiter was finally correct across multiple instances, and getting there cost 289 microseconds per request — about 3,930× a local decision — plus a new dependency that could take down the service it was installed to protect.
I sat with that for a while before noticing I'd answered the wrong question.
The thing I should have noticed sooner
A rate limiter calling Redis on every request is asking the same question over and over and getting an answer that barely moves. Ninety-nine times out of a hundred it's "yes, you have quota" — and it'll still be yes for the next ninety-nine.
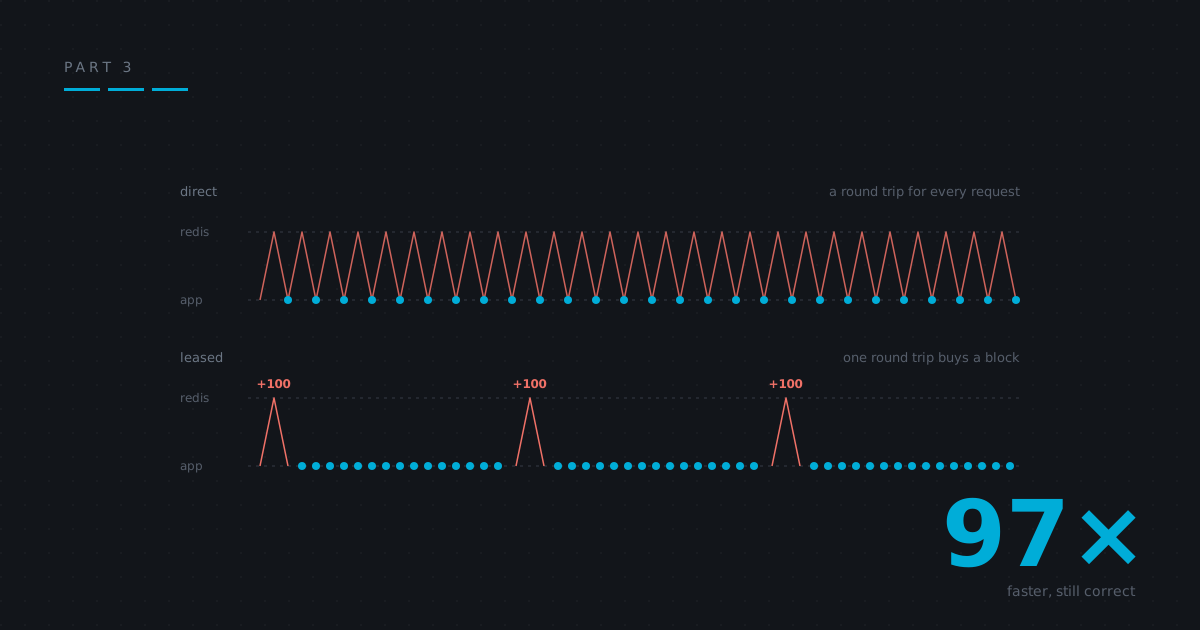
So stop asking per request. Ask for a block, then serve from it locally.
without leasing                    with leasing (lease = 20)

req 1  ──► Redis  ──► yes          req 1  ──► Redis ──► yes, take 20
req 2  ──► Redis  ──► yes          req 2  ──► local
req 3  ──► Redis  ──► yes          req 3  ──► local
  …                                  …
req 20 ──► Redis  ──► yes          req 20 ──► local
req 21 ──► Redis  ──► yes          req 21 ──► Redis ──► yes, take 20

20 round trips                     1 round trip
The coordination isn't eliminated, it's amortised. One round trip buys twenty decisions.
This is the same move as buffered I/O, or batched database writes, or a CPU fetching a cache line instead of a byte. None of those invented a cleverer algorithm. They noticed the unit of work was smaller than the unit of cost.
What I liked about building it: it isn't a new limiting algorithm at all. It's a caching layer over the one from Part 2, and it accepts any limiter as its remote — which is the Limiter interface I designed in the very first phase finally paying off in a way I hadn't anticipated when I wrote it.
The dial, measured
Each instance keeps a little state per key: how many units it's claimed and not yet served, when they expire, and whether Redis recently said no. A request either spends local quota, or triggers a lease.
Then LeaseSize becomes a dial. Here's what it actually does — one key, everything admitted, redis/op is a custom benchmark metric counting round trips per request:
| lease size | ns/op | vs direct | redis/op |
|---|---|---|---|
| — (direct) | 183,453 | 1× | — |
| 1 | 184,296 | 1.00× | 1.000 |
| 10 | 18,979 | 9.7× | 0.1000 |
| 100 | 1,882 | 97× | 0.01000 |
| 1000 | 272.1 | 674× | 0.001000 |
redis/op lands on exactly 1/leaseSize at every step, which was satisfying in the same way the 24.6-bytes-per-timestamp result was in Part 1 — arithmetic showing up in the measurement without rounding.
The row I want to point at is LeaseSize: 1. There, leasing does nothing at all — every request still costs a round trip — and it costs 0.46% to have the option. That matters more than it looks: the dial goes all the way back to Part 2's behaviour for essentially free. It's a knob, not a separate code path with its own risks.
Allocations also fall from 18 to 0, because past lease size 100 the Redis client's command encoding has disappeared from 99% of requests.
The number that changed how I'd choose
Look at what each 10× step actually buys:
| step | latency saved |
|---|---|
| 1 → 10 | 165,317 ns |
| 10 → 100 | 17,097 ns |
| 100 → 1000 | 1,610 ns |
Each 10× increase in lease size saves 10× less latency — while costing 10× more accuracy. The benefit-to-cost ratio falls by 100× per step.
That's not a gentle tradeoff curve, it's a cliff, and it means the useful range is narrow and sits at the low end. The bottom row of that first table — 674× faster! — is a bad trade dressed up as a big number.
You can see the floor arriving in the measurement, too. At lease size 1000 the amortised Redis cost is 183 ns per request, but the measured total is 272. So roughly 90 ns is the local path itself — a sync.Map lookup, a mutex, some arithmetic. Past that point you're buying accuracy loss in exchange for latency that's no longer there to recover.
I would not have guessed the shape of that curve. I'd have assumed "bigger lease, better, with some accuracy cost" and picked something round like 100.
Two details that mattered more than the idea
The lock is held across the network call, on purpose.
The obvious objection to this code is that it holds a mutex while making a Redis call, blocking every other goroutine that wants that key for a full round trip.
That's the point. Without it, a hundred goroutines arriving at an exhausted lease would each independently decide to lease, and fire a hundred simultaneous Redis calls for a key that needs one. The thundering herd shows up exactly when the system is busiest, and the whole amortisation evaporates at the moment you need it.
Holding the lock means one lease request in flight per key, and everyone queued behind it gets served from the block that arrives. They pay one round trip of latency — which they'd have paid individually anyway, without leasing. The lock is per key, so unrelated keys never wait on each other.
Denials have to be cached, or overload makes it chattier.
When Redis refuses a lease, the naive version asks again on the very next request. Under sustained overload — when everything is being rejected — that's a round trip per request, which is worse than not leasing at all.
The failure mode is perverse enough to be worth saying plainly: without denial caching, the optimisation works when you don't need it and stops working when you do.
So a refusal is remembered until the RetryAfter Redis advertised, and rejections during that interval are served locally with no network traffic. The effect shows up clearly in the fleet test — at LeaseSize: 1, where leasing itself does nothing, 1000 attempts against a limit of 100 cost 103 Redis calls, not 1000. A hundred admissions, plus one refusal per instance that nine hundred subsequent rejections were served from.
The system gets quieter under overload instead of louder, which feels like the right direction for a component whose job is surviving traffic.
Why unspent quota has to rot
An instance that leases 20 and serves 3 before its traffic moves elsewhere is sitting on 17 units nobody else can use. Redis already counted all 20 as spent.
Left alone, that's worse than wasteful — it's wrong in the other direction. The global limiter regenerates those 20 units over time, and if the instance still holds its 17 it can spend them later, on top of freshly regenerated quota. Hoarding converts a temporary under-admission into a permanent over-admission.
So leases expire. The natural TTL turned out to be the time the global rate takes to regenerate a lease's worth of quota, because at exactly that moment the units being discarded have been replaced upstream and the books balance.
There's also a small thing I got wrong first time. A lease of 30 against a global limit of 100 doesn't divide evenly: after three leases there are 10 units left, and a request for 30 gets refused even though the caller only wanted one. So a refused lease falls back to asking for exactly what's needed. Without that, the limiter systematically under-admits by up to leaseSize - 1 per window — which the conformance suite from Part 1 caught immediately, in a test I'd written six phases earlier for entirely different reasons.
What the accuracy actually costs
On paper the error is bounded: instances can only spend what Redis granted, so fleet-wide drift is capped at instances × leaseSize.
I measured it with three instances, a limit of 100, and 1000 attempts:
| load | lease 1 | lease 5 | lease 20 |
|---|---|---|---|
| uniform (round-robin) | 100/100 | 100/100 | 100/100 |
| skewed (two instances get 5 requests, then go quiet) | 100/100 | 100/100 | 70/100 |
Under even load, leasing is exactly correct at every lease size. That surprised me. The logic is simple in hindsight — instances can only spend what they were granted, and even load means they spend all of it — but I'd expected to see drift.
The error only appears when an instance takes a block and then stops receiving traffic. And the mechanism is precise: each quiet instance got five requests. At lease size 5 it leased five and spent five, stranding nothing. At lease size 20 it leased twenty and spent five, stranding fifteen — twice over, for a shortfall of exactly 30.
So the realised error isn't instances × leaseSize. It's:
Σ over instances of max(0, leaseSize − requests that instance received)
The bound is the worst case, where every instance takes a full lease and serves nothing. Real traffic rarely goes near it. But the worst case is what you have to be safe against, and that gives a sizing rule the design didn't state until measurement forced it:
instances × leaseSize has to stay well under limit, or there's no guarantee left. At a limit of 100 across three instances, lease size 100 gives a bound of ±300 — the possible error exceeds the thing being limited. Even 20 gives ±60. Something like leaseSize ≤ limit / (4 × instances) keeps the worst case under a quarter. For 100/minute across three instances that's a lease of 8 — which the first table says still removes about 90% of the coordination.
When Redis is gone
Leasing softens this. An instance with unspent quota keeps serving through a blip. But a lease runs out eventually, and then a decision has to be made with no information at all.
There's no correct answer here, only a policy, and both options are bad in different directions.
Fail open — admit. The service keeps working, unlimited. If the limiter was protecting something fragile, that thing is now unprotected during an incident that's already underway.
Fail closed — deny. The limit is enforced, absolutely, by rejecting everything. A Redis outage has become a total outage of your service, caused by a component that exists to improve reliability.
I went with fail open as the default, and the argument is this: a rate limiter is almost never the primary function of the service it sits in front of. It's a safety mechanism. Turning the failure of a safety mechanism into a full outage inverts the reason it was installed — you've built a component whose breakage is strictly worse than its absence. It also matches the blast radius. Redis being down is one failure; your service being down is a bigger one.
It's not a novel position, for what it's worth: Envoy's rate limit filter ships with failure_mode_deny set to false for the same reason.
Flip it when the thing being protected is worse to lose than the service itself. A limiter in front of a payments API, or an expensive inference endpoint, or anything where unbounded traffic costs real money or corrupts state, should fail closed. The question to ask is: if this limiter vanished entirely for ten minutes, what happens? If the answer is "a large bill" or "data corruption", fail closed. If it's "elevated load", fail open.
The part I'm least comfortable with
When degradation kicks in, my limiter returns a decision and a nil error.
That's a deliberate choice and it still nags. Way back in the first phase I put error in the interface precisely so a distributed limiter could say "I don't know" — and this is a limiter that knows it doesn't know and answers anyway.
My justification is that a policy configured once beats a decision re-derived at every call site. Propagate the error and every caller writes the same if err != nil { allow anyway } block, and they will not all write it the same way — some will fail closed by accident, because that's what an early return err does.
But Part 2's whole lesson was that the dangerous failures are the silent ones, and a limiter that quietly stops limiting is exactly that. So degradation is loud by construction: there's an OnDegraded callback and a counter in Stats(), and the documentation says in those words that wiring neither is how you end up unlimited for a week without noticing.
I'm not sure that's the right call. It's the call I'd defend, which isn't quite the same thing.
What's still broken
Worth being explicit, because "we fixed it" is rarely true:
A single hot key still converges on one Redis key on one single-threaded server. Leasing divides the rate by
leaseSize, which is a large constant factor, not a change in shape.Redis is still a single point of failure. A degradation policy is a way to survive it, not a fix. Sentinel or Cluster is the fix, and I didn't build it.
During an outage, clock skew comes back — each instance is on its own clock again, with none of the shared time source from Part 2.
A smarter fallback exists and I didn't build it. Instead of binary open/closed, degrade to a local limiter at
limit / expected_instances, keeping approximate enforcement during an outage. It needs to know the instance count, which Part 2 established is a number nobody reliably has. It's the right next step and harder than it looks.
Looking back at the whole thing
Three posts, eight phases, and an arc that wasn't obvious when I started:
Local state is wrong across instances. Three replicas admit 300 against a limit of 100, and no component can see it.
Shared state is correct and costs 3,930×.
Most of that cost was coordination nobody needed. Leasing recovers 97× of it for a bounded, measurable error.
But the thing I'd actually take to the next project isn't about rate limiting.
It's that measurement kept contradicting things that sounded obviously true. Per-key locking won every latency benchmark and was still the wrong default, because it costs 2.57× the memory and rate limiter keys are attacker-controlled. GCRA's 8-byte state was going to make it the cheapest per key; it's 127 bytes, because being lock-free forces an expensive container. Sharding is slower than a plain mutex until you have contention. And a bigger lease keeps helping right up until the point where it's buying nothing and costing a lot.
Four predictions, all reasonable, all wrong in ways that only a number could show. I started writing "obviously" as a note to go and check.
The other thing: a test suite is a floor, not a ceiling. Mine encoded nine properties I thought were universal. Two of them turned out to be artefacts of having only written four implementations from the same family, and it took a genuinely different algorithm to reveal it. I changed the tests and wrote down why, which felt wrong at the time and was clearly right afterwards — a suite you edit to stay green isn't measuring anything at all.
Thanks for reading. If you build one of these, I'd start with the conformance suite before the limiter. Everything useful I learned came from something failing a test I'd written before I knew what it was for.
All of it — code, benchmarks, and the design notes written during each phase rather than after — is at github.com/Jeetjyoti-Deka/go-rate-limiter. Every phase is tagged, so you can check out any point in the story and run it.